Finance
Quarterly Report Made Easy
Inspiration
In large organizations, each department often needs to create a quarterly report that includes initiatives, tasks, metrics, and visualizations to present to top executives. Important work such as analysis and metrics is often done in software like Looker, Databricks, or SQL. Even after this work is completed, employees often spend weeks manually transferring data from these sources into slides and polishing them. We eliminate this busy work so you can focus on the real work.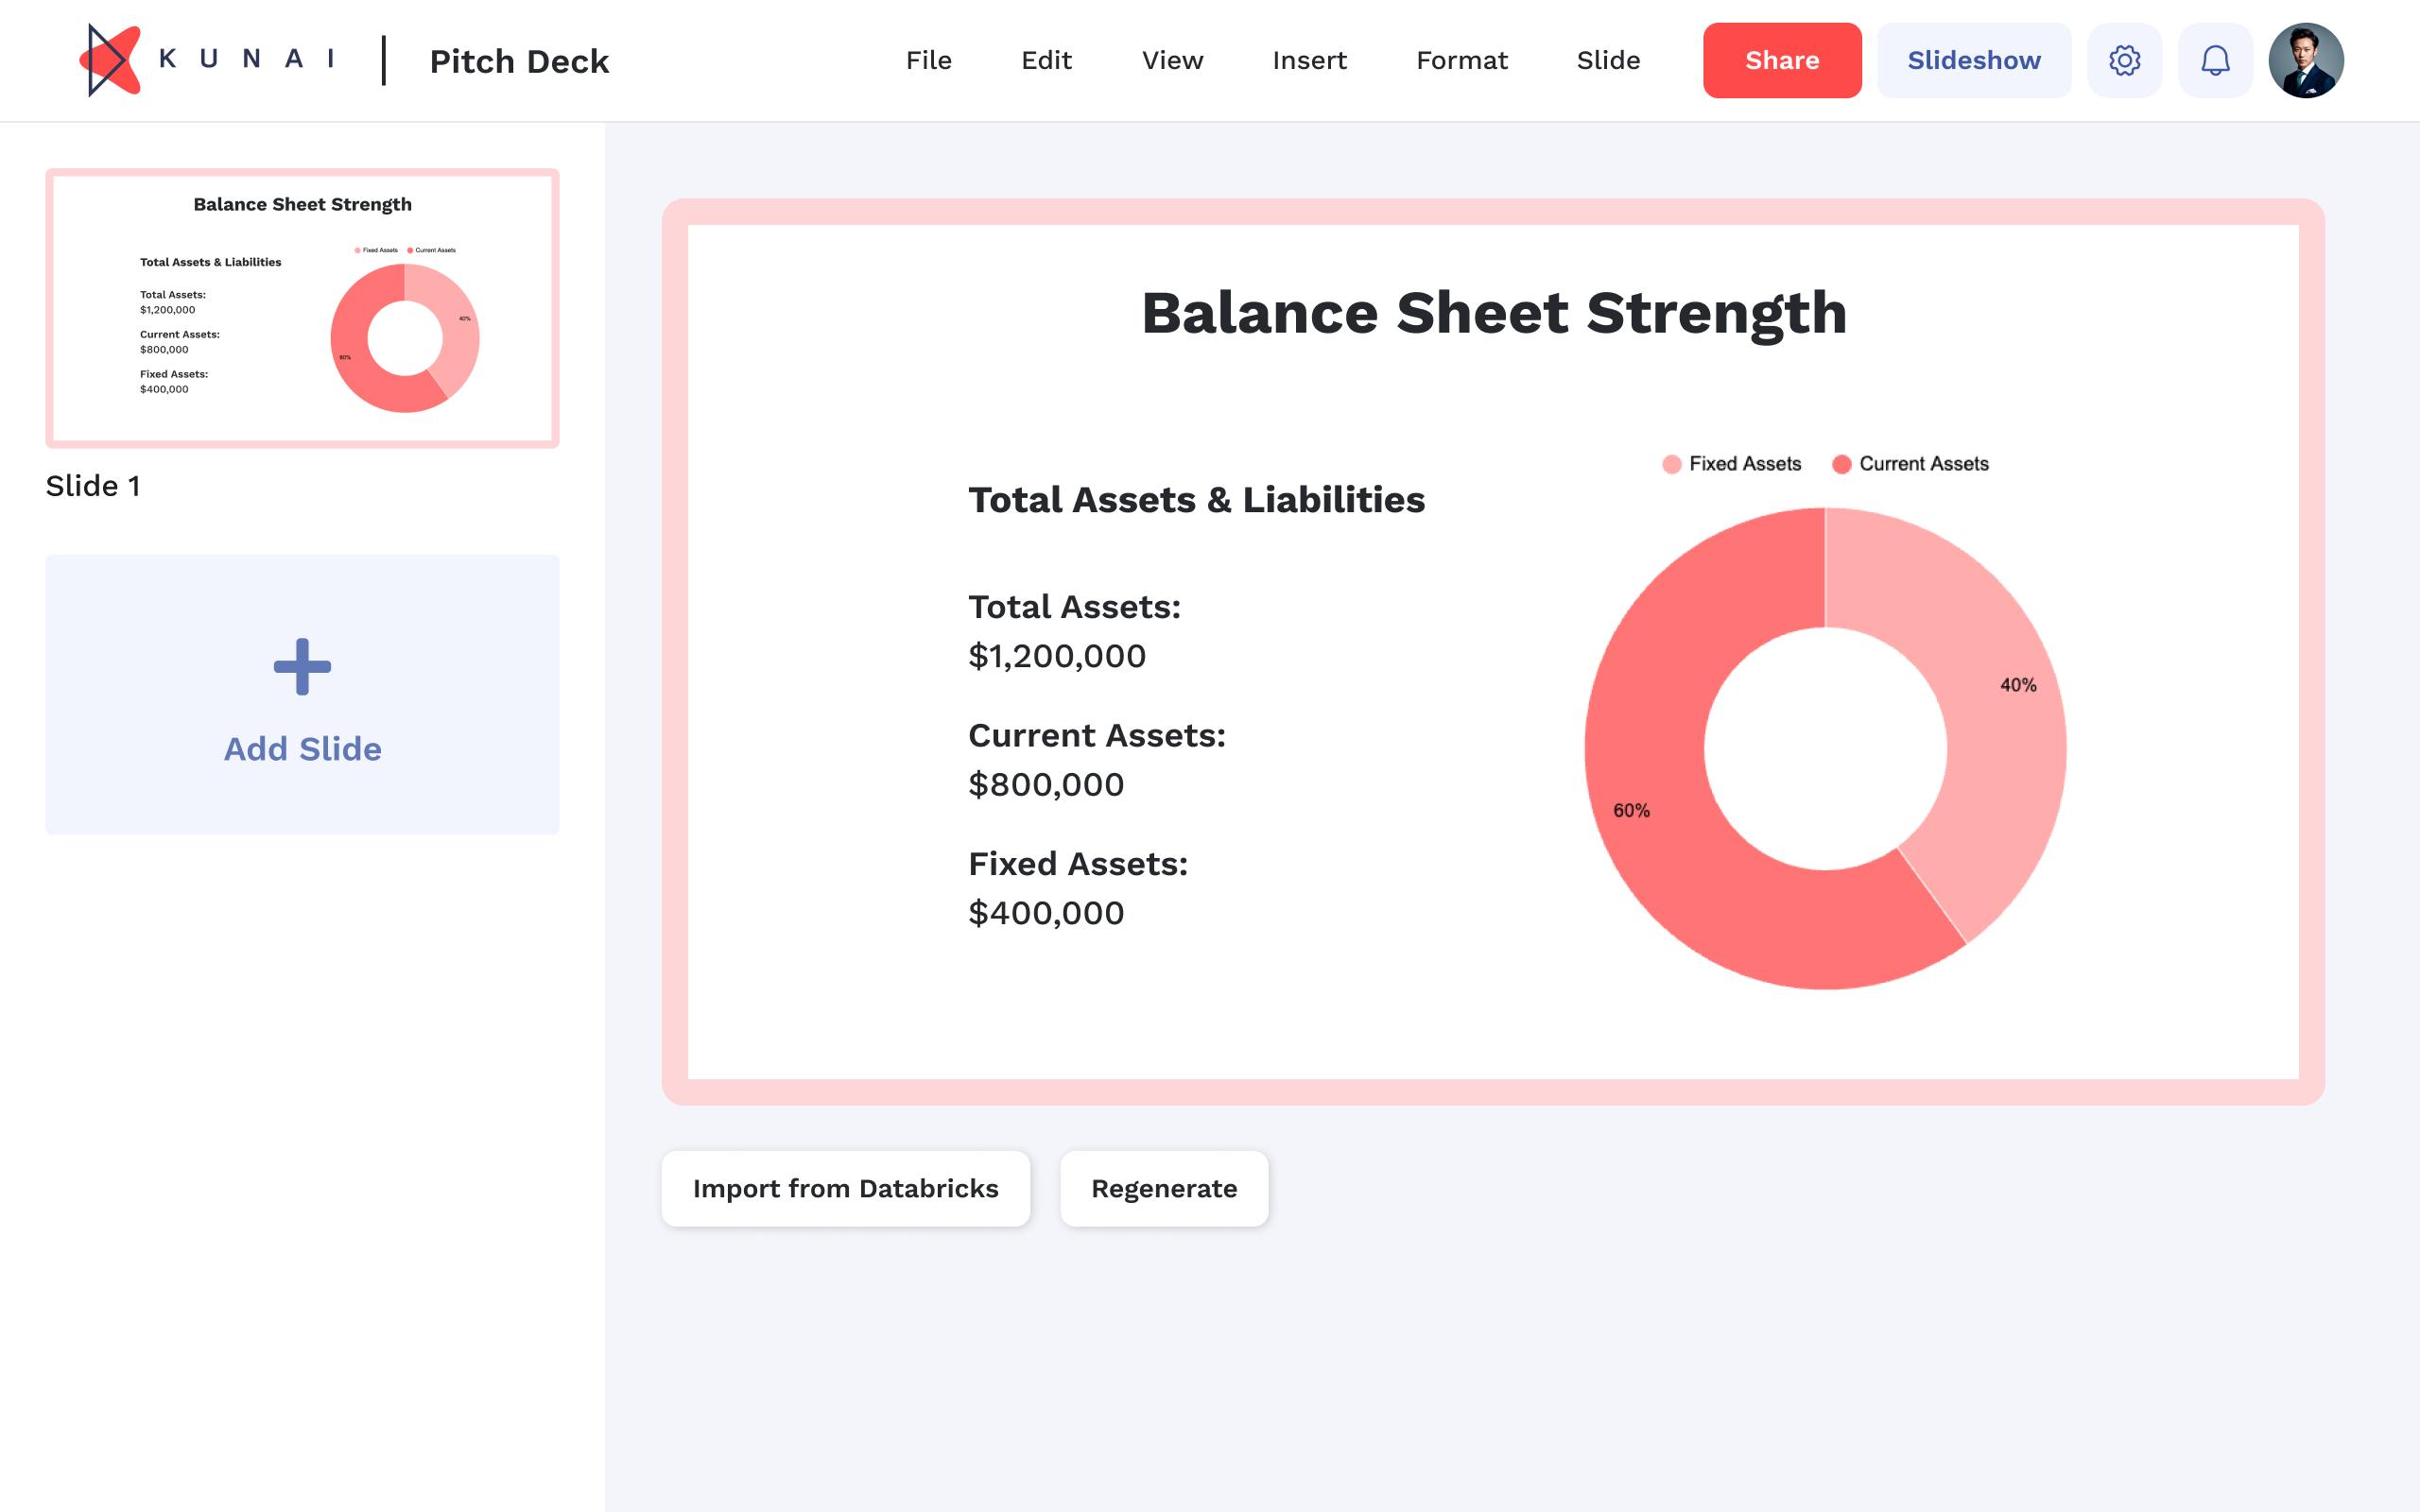
Opportunity
Every employee knows the feeling of spending hours polishing slides, importing graphs, metrics, and visualizations. With Kun.AI, we can eliminate this busy work using AI. Focus on the real tasks such as computing analysis and creating metrics and graphs, while we handle the tedious manual work of formatting and polishing. This can save employees hundreds of hours and make analysis available more quickly and accessible to everyone in the organization.
Kun.AI Process Automation
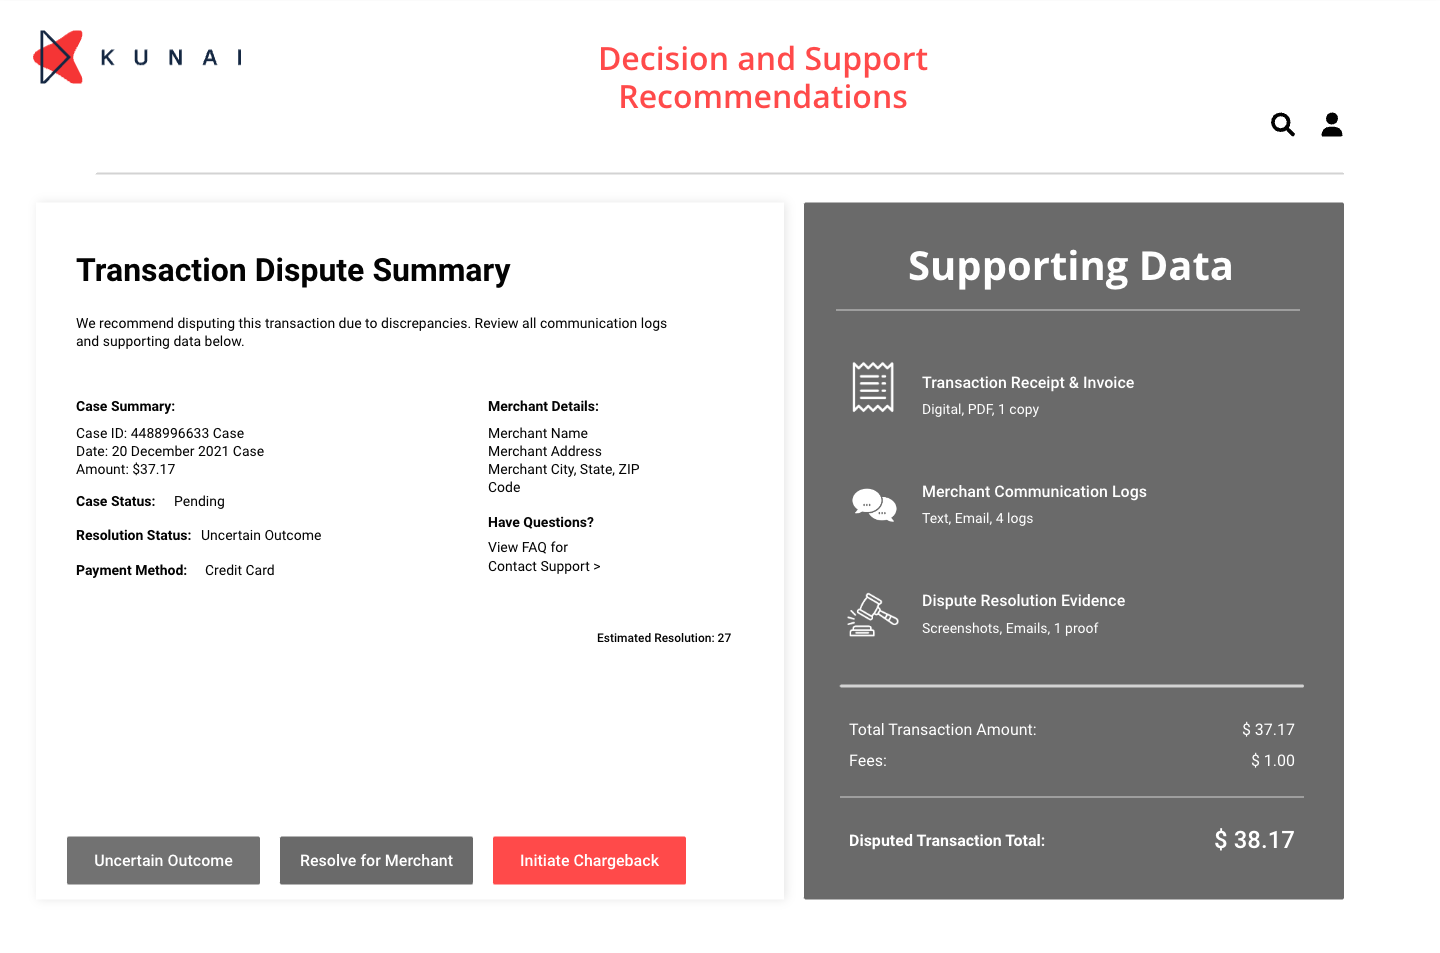
Kun.AI automates the process by using a rubric that defines all the metrics and graphs required for the presentation. It searches through all available data sources for this information and identifies the owner of each visualization or metric based on the creator. Then, it synthesizes a slide and emails the owner, informing them of the slide's creation and the data used. The slide owner can approve or reject the slide and provide feedback, which further improves the AI.
Automation Flow
Let's talk about your next big project
Get in touch with our tech and product experts to discuss a new project or learn more about our services.
Copyright © 2024 Kunai Co. All rights reserved.